Thursday, September 27, 2012

The thing about thinking

When facing a math problem, any problem really, that one is motivated to solve, one thinks about it. Maybe not for long, and often in non-productive ways, but still.

I believe that when many students face math problems, their thinking goes something like this:
  1. I can't do this, can I do this? Maybe, but no probably not, or can I...?
  2. What should I do? What method should I use? 
  3. Where is the example I should copy?
  4. It says "triangle" in the question, where are the trig formulas?
  5. What should I plug into the formulas?
This approach is almost complete procedure-oriented, and often the student launches into a procedure without even bothering to really understand the question.  I had a student asking for help recently with a question on compound interest, in which someone had first received 4% p.a. interest for 5 years, and then 3.25% p.a. for the next 3 years. This student understood the idea of compound interest, and knew how to calculate how much there would be after 5 years, but "didn't know what number to plug in for the capital for the second investment period." 

Schoenfield, in this article, shows a time-line of student thinking during a 20 minute mathematical problem solving session. In daily activities such as classwork or homework, I think the student would have given up after 5 minutes. 

While I'd like their thinking to go like this: 
  1. What does the question mean? How do I know I understood it correctly? 
  2. What mathematical concepts and language represent the type of event that is described in the question?
  3. What information do I have? What am I looking for? 
  4. So what's the plan: how will I get what I'm looking for?
  5. Am I making progress towards a solution, or should I rethink my approach or my understanding of the question?
Schoenfield, presents this timeline of a mathematician solving a problem: 
(each marker "triangle" represents a meta-cognitive observation)

So I'm wondering: why are the students preferring non-productive thinking, and how do I get them to change thinking strategies?

My guess is, most students use non-productive thinking because 
  • they don't care enough about mathematical questions to try to understand them
  • they feel stressed when facing mathematical questions, and stress is bad for thinking
  • they have been rewarded for this type of thinking before, with teachers who provided examples and then "practice" exercises which only required copying examples
  • Their teachers and textbooks have exclusively focused on mastery of procedures
  • Finally, some students (especially in younger ages) may have cognitive developmental difficulties in understanding abstract mathematical concepts, while copying procedures is possible even for monkeys.
So what's a teacher to do?  Schoenfield suggests the following teaching strategies: 

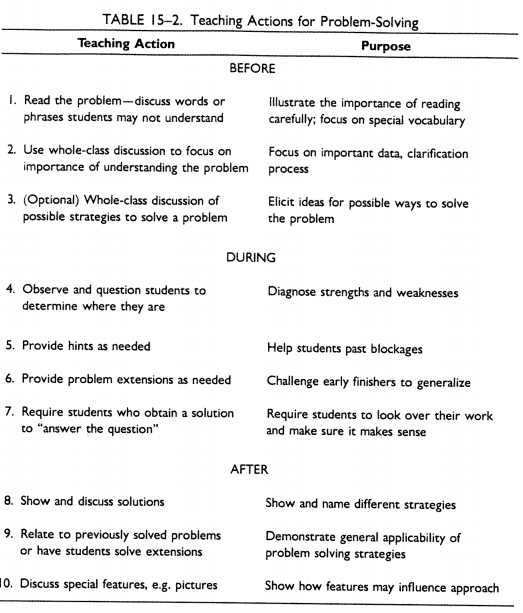
The good news, according to Schoenfield, is that teaching strategies such as those he lists above can bring about dramatic changes in student thinking.


The bad news, is that in this time-line students are still spending almost no time at all analyzing the situation. They do have more meta-cognitive monitoring, and they seem to be planning the approach, but it seems that the approach is still heavily procedure-driven. 

So maybe just problem solving (with rich problems) and good teaching strategies surrounding problem solving are insufficient tools for changing student thinking in the direction of understanding. Perhaps we need to give them other types of questions altogether, questions that do not require calculation - but rather "simply" understanding. Malcolm Swan's set of five activities for increasing conceptual understanding are excellent for this purpose. He describes them superbly in this document. Above all, I hope that by using activities that ask students to categorize examples, match different representations, and evaluate mathematical statements, students will learn to aim first and foremost for understanding instead of procedure.


Tuesday, September 25, 2012

A nasty shock

We're starting to work on coordinate geometry, which should be a review of lines: gradients, intercepts, equations, graphing. Students are expected to know how to work with lines since they've been doing it every year for at least four years or so. Yet I always find that students struggle to use points to find the equation of a line.
This time, I decided to first make sure that students were able to see whether a line passes through two points. I designed a small matching activity: given some cards with equations on them, and some cards with pairs of points on them, match the equations with the pairs of points. After they matched everything that it was possible to match, some odd and some empty cards would remain. I was hoping students would use the understanding they developed/formalized during the matching activity to come up with suitable matches for the odd cards.

You can find the cards here.
¨
Easy as pie? No. It turns out that not one of the students in my class (11th grade) were able to match the equations with the points. They had simply no idea of how the x and y in the equation related to the x- and y-coordinates of the points. What the hell have they been learning for four years?

Some approaches that students tried were:
  1. Getting the gradient by using two points, then comparing this gradient to the one in the equation. Fine, as long as there is just one equation with that gradient.
  2. Graphing the equations ("but we don't remember how to graph lines from equations") and see if they pass through the pair of points. Fine, if they understood how to graph the lines and if the scale of the graph was appropriate.
  3. Making a table of values, to see if the pair of points would come up as a pair of values in the table. Fine, as long as the points have integer coordinates and the person has a lot of time and patience.
All these approaches show students struggling to find a method that works, without really aiming to understand the information given in the question. I blame the students' past textbooks. The one they had last year, for example, presents lines and equations and parallelism and perpendicular lines and how to find gradient and intercept from 2 points - and only then presents how to check if two points are on a line or not. I'm thinking of writing those authors a very nasty letter.

Sunday, September 16, 2012

Simple and Compound interest: a sorting activity

This is very basic, and does several good things:

  • Connect to student understanding of sequences and series (which we had studied the previous weeks), percent, and functions (mine haven't studied exponential growth yet).
  • Get students discussing concepts such as interest rates, loans and repayments
  • All my students were very actively engaged with thinking and arguing about this activity
  • Somewhat self-checking, especially once I told the kiddos that the two columns should be of equal length


What to do: 
  1. Cut out each rectangle and give small groups of students a set of all the rectangles. 
  2. Tell them to sort them into two categories. Or don't tell them the number of categories. 
  3. Eventually hint that the categories should have equal number of rectangles.
  4. When groups are almost done, walk around and check on their categories, giving hints and pointing out conflicts without giving the solution to the conflict.

When groups are done, I lead a whole class discussion in which the main ideas of simple and compound interest were introduced and defined, and students got a few minutes to derive the general formulas for these types of interests. 

I ended the lesson by asking how much Jesus would have had in the bank today, if his parents had invested 1kr at 1% annual interest when he was born. This helped students get the idea that given enough time, compound interest far outgrows simple interest. 

Wednesday, September 12, 2012

Update to conflict and discussion in descriptive stats

Well now, yesterday I gave a brief diagnostic quiz about finding mean and median from a frequency table. I wanted to test retention of the methods we had developed the previous lesson. The results were... interesting.

  • About half the class could find the mean, and a bit less than half could find the median. Some students wrote out the raw data first to find these values, and some didn't. I would of course prefer that they didn't have to write out the raw data, however even the fact that they spontaneously make the connection from frequency table to raw data is an important improvement that shows understanding of how the two representations fit together. In the previous lesson, no one started out being able to find mean and median, so overall it's an improvement to see that about half the class now could do it.
  • The other half that couldn't find the mean and median seemed to use the same, incorrect and illogical, methods that they had suggested the previous class, almost as if they hadn't already seen that the method was faulty. 
  • After a very brief go-through of finding the mean and median, we moved on to measures of spread. At the very end of the hour, students received another frequency table and were asked to solve for central tendencies and also measures of spread. This time, it looked to me that all the students in class could find the mean, though some still struggled with the median. Likewise, finding quartiles does not come easy to my students.

What I'm wondering: 
  • Did some of the students practice understanding and procedures between the two lessons, and might this account for the differences in retention?
  • When solving the last example at the end of the lesson, were students doing solving it through understanding, or were they simply copying the procedure of the worked example that we did together?
  • Why is it so tricky to find the median and quartiles? Are the students simply not as used to this as they are to the mean? Are they still struggling to get the feel of what the numbers in a frequency table represents?
  • Is the retention better than students would normally have after a guided-discovery or direct instruction lesson?

Friday, September 7, 2012

Conflict and Discussion in basic descriptive statistics

Just a quick update: yesterday I was going to have a very boring "you should know this but let's review anyways" lesson on descriptive statistics. It didn't turn out that way.

First, I asked the class for how many siblings each student has, and wrote the numbers on the board.
I asked them how to represent the data in a more presentable way, and we made a frequency table.


I asked them "would it be OK if I erased the original data now that we have a frequency table showing the same information?" Bored yes from everyone. Evil grin from me.

After a column chart (with lots of students wanting to do a histogram instead, so some discussion on that) and a relative frequency column added to the table, the class suggested we find the mean of the number of siblings. Now is when the fun started.

Me: "Any suggestions?"
S1: "Add all the numbers 0-5 and divide by 18."
Me: OK, (0+1+2+3+4+5)/18 = 0.83.
S1, S2, S3: that can't be right. Most of us had more than 1 sibling, and this shows less than 1.
Me: well, if this isn't right, then discuss among yourselves what could be the mistake here, and how could we fix it. 
Now I don't know about other kids in other schools, but my kids ALWAYS have trouble finding the mean (and median) from a frequency table. It's like they immediately lose track of the meaning of the table. This time, some very interesting and silly approaches were developed.

S1: (0+1+2+3+4+5)/6 = 2.5
S2: (1+4+6+4+2+1)/18=1
S3: (1+4+6+4+2+1)/6=3

In some cases, students laughed at their own attempts. S2 did this, when she realized she has just summed up all the students and divided by the number of students. S3 also realized his answer was too high to be reasonable, but needed prompting from me to see there was a conflict. S1 however did not realize there was a conflict, and her answer seemed reasonable, too. So I stepped in and pointed out that she didn't take the frequency column into account at all, and that her answer would have been the same even if everyone in class would have had 0 siblings.

After repeated attempts that led to conflicts of different kinds, I think that some kids started to realize the problem: they needed to somehow take the values in both columns into account. But how? Some kids came up with multiplying the siblings and the frequency, but it was only after I explained to the whole class how we could re-create the original data and then find the mean that the class understood (with a collective "Oooh!") what the method is and why it works.

Another conflict occured when students were finding the median. They once again focused on only the sibling-column or the frequency column, but more students this time used the original data and got that the median was 2. This solution was presented to the whole class. A moment later I asked the class how we could avoid writing out the original data ("what if there were 1000 students in this class?") and one student responded that we should average the middle numbers in the frequency column: (6+4)/2=5.
She, and other students, seemed unaware there was a conflict between this answer and the one they knew was right, because they'd gotten it from the original data. So I pointed it out and once again gave the class time to discuss other strategies to use the table. We were running out of time, however, so I wrapped it up rather too quickly by having one student explain his (correct) way of thinking.

Lessons learned:

  • I wasn't aiming for a conflict and discussion feel to this class, hadn't planned any of it, but took the opportunities that presented themselves because I'd read up on this method the day before. It's nice to see that not all improvements in teaching need to be painstakingly planned
  • Planning would have helped, however. For one, the data could have been such that all common mistakes produced answers that were clearly in conflict with the data. Then I would not have needed to tell the students there was a conflict, they would have noticed it themselves. 
  • A conflict very obvious to me may not be obvious to the students. Some teacher guidance, or carefully orchestrated group work, is therefore necessary to expose the conflicts and make them available for discussion. 
  • Multiple representations are a problem for students: on one hand, they can easily move from data to frequency table to column chart - but I shouldn't assume they can go the other direction or that they recognize when one representation is in conflict with another.
  • Students were very on-task and seemed more interested than usual. They had started this lesson expecting boring-ol-stats again, but then were lively and active throughout the lesson in a way I haven't seen from this group before.
  • Discussion took time. I let it. We were going to "cover" range and standard deviation this class, too, but that just didn't happen. On the other hand, maybe the students will now have more solid understanding of frequency tables which will allow us to not spend as much time on measures of spread.
Next class (Tuesday) I'll give a short diagnostic quiz to see whether students have retained how to find mean and median from frequency tables. More on that later.

Thursday, September 6, 2012

Holy shit, I need to do this.

So today I googled "cumulative graph" and ended up rethinking my philosophy and practice of teaching. Doesn't happen every day, to say the least.

Here's how it happened: "cumulative graph" lead to this site, which introduced me not only to what seems to be an outstanding researcher and communicator, Malcolm Swan, but also to a whole set of awesome activities for teaching statistics, algebra, and other things.


Malcolm Swan thus really caught my interest, and google led me to his summary of effective teaching strategies which is extremely user friendly for teachers. What really made me cringe and laugh and decide to shake things up was this collection of powerpoint slides, and especially his comparison of "guided discovery" (what I do a lot of) and "conflict and discussion" (which I mostly do by accident).

To compare the two methods, Swan shows us a problem from from Brekke, 1986, but I think the correct  reference is: "Bell, A., Brekke, G., & Swan, M. (1987). Misconceptions, conflict and discussion in the teaching of graphical interpretation." (If someone can find the full article/book excerpt I'd be most grateful, because it's not available through my university library database.)


The Guided Discovery approach: 

Ouch. I do that. I thought this was the way to do it, you know, guided discovery is the shit, right?
But when someone puts it like this, I don't want to do it no more. 

By contrast, the Conflict and Discussion approach involves
  1. Individual work
  2. Discussion in small group (opportunity for conflict when group members have different suggestions)
  3. Writing about what happens in the problem
  4. Drawing a graph
  5. Interpreting the graph back into words  (opportunity for conflict when words don't match the writing in step 3)
  6. Discussing the solution with the whole class (opportunity for conflict when classmates have other suggestions)
  7. Final (long) discussion about what common errors people make, and why. 
Each time there is conflict, students restart from step 1. 

Results-wise, Swan cites two studies that find that student concept attainment (as measured by pre- and post-tests) is greatly increased in the Conflict and Discussion method. Astoundingly, students retain their understanding even months after the lesson. I think that's what convinced me that give this a serious try. 

OK, so how? Well, conflict seems to me to come from several sources: 
  1. Students self-check and find that their solution doesn't work or make sense
  2. Comparison with other students reveal conflicting solutions 
  3. Students are shown examples of something that they have a hard time fitting into prior concept.
Building these conflicts seems to require the teacher to above all lay off giving the answer, and instead focus on challenging the students with prompts such as "check if it makes sense" and "compare with that guy" or "well how does .... fit with what you're saying?". Actually, I think another way to create conflict is telling the student that his solution makes no sense or is incorrect (even if it's perfectly correct and makes perfect sense) and then just walking away. I'm not sure that will breed a healthy type of frustration in all students, though. 

My main problem, as usual, is that discussions take time, and time I don't have. Swan argues that according to research results, it's more effective to focus on just a few problems in depth than many similar-but-slightly-different questions superficially. I'm going to try this, so let's hope he's right.