I'm planning to use the following sort-in-order activity with a group that will review calculus and especially struggled with optimization.
For each group - 2 to 3 students - I will make horizontal cuts across the paper, so that each step, why, and example will be on one piece of paper, and then shuffle them. The kids are then instructed to put the pieces in order of how they would solve an optimization problem that will be different for each group of students. They are also asked to provide an explanation for why each step is done and the example solution problem they are assigned.
I wonder if this task would also work as an introductory activity to optimization, as in: make sense of this, given whatever conceptual understanding you have of derivatives.
Any feedback on this?
Saturday, December 20, 2014
Wednesday, December 17, 2014
Apparently, this is how to teach my kids vector equations of lines
Vector equations of lines usually hit my students like a nasty shock, after weeks of soft and cushy work with vector operations. This year, I tried a constructive approach, using this silly and in my opinion boring and too structured investigation:
The plan was that students should use this geogebra activity together with the written instructions. That immediately failed, since school computers did not have updated geogebra. So they used mini-whiteboards instead, and it worked well. And when I say it worked well, I mean it worked amazing. I have no idea why, because seriously that investigation isn't exactly a masterpiece of pedagogy, but this group of students caught on to both the activity and the conclusions. Above all, even the weakest students in class could arrive at, explain and use vector equations of lines.
The plan was that students should use this geogebra activity together with the written instructions. That immediately failed, since school computers did not have updated geogebra. So they used mini-whiteboards instead, and it worked well. And when I say it worked well, I mean it worked amazing. I have no idea why, because seriously that investigation isn't exactly a masterpiece of pedagogy, but this group of students caught on to both the activity and the conclusions. Above all, even the weakest students in class could arrive at, explain and use vector equations of lines.
Thursday, September 4, 2014
I am SO back
Wow, take a break for 18 months and when you're back, things are the same (whiteboards) and different (each kid with their own laptop, and oooh, check out Desmos). So what did I do? Completely screw up (in a let-this-be-a-warning-to-you-all kinda way) one of my first lessons with a smart, nice group of seniors.
I've been debating this with myself. Should my first blog post after an extended break be about a teaching mistake? Doesn't everyone want to get inspiration for good teaching, rather than bad? Nah. We all need to learn from each other's mistakes, and we should discuss them rather than pretend we never make any.
So, with that in mind...
The aim of the lesson was to introduce students to derivatives of trig, exponential, and logarithmic functions.
I decided to use Desmos for an investigative activity (technology! and inquiry-based math!).
I created a graph with instructions, and shared with my students.
In case you're too lazy to click that link and check out the instructions, here's a summary:
- Check out the graph of f(x)= sin(x). What do you think the derivative will look like?
- Ask desmos to graph derivative. Huh. What IS that function do you think? Graph your guess to see if it is correct. If it's correct, write down your conclusion. If not, try again.
- Repeat with cos(x), tan(x), e^x, and ln(x)
Once students got the hang of the instructions, they engaged very actively with the task and were more or less successful with guessing the derivative functions. At the end of 30 minutes or so we could summarize the findings. Everyone was happy. It felt like an awesome lesson.
But it was crap. I realized it a while later, out of nowhere. There was nothing to trigger conceptual understanding, no variety of thinking and problem-solving. Instead of consulting desmos to ask for derivatives, students would have been better served by using their formula booklets, which is what they'll have on exam,
I'm writing this lesson up as a warning example of the seductive nature of technology and inquiry-based teaching. Both have their place, of course, but only as tools for obtaining specific goals relevant to learning.
In this case, what I should have done, is to build on student understanding of the derivative as a gradient function by assigning them to groups, one per function, and having each group work old-school with paper and ruler to draw tangents, estimate gradients, and plot the derivative function based on these values. Then they could have tried to identify the formula of that function. How do you beat paper and ruler for an activity like this? You don't.
Monday, February 4, 2013
Why it's been a while, and will be a while longer
 |
| Hannah, a lovely distraction born December 20, 2012 - here 6 weeks old |
Although... while I was still pregnant and teaching, I realized that pregnancy and child-rearing presents the curious parent with lots of authentic mathematical questions of varying complexity and difficulty. Here are some preliminary notes on ideas:
- What are the chances of getting pregnant? Contraceptive technology offers a summary table, which informs us about how many women per year, using each of the methods, gets pregnant. How do we translate that into risk of pregnancy per "occasion"?
- What are the chances of getting pregnant when one tries? This somewhat depressing graph implies that the chances decrease for each month one is trying, but why? And isn't there a problem with the graph?
- Miscarriage is such an ugly word, but let's face it: most pregnant women worry at some point or other about whether they'll get to keep the baby. Data on spontaneous abortion (not any less ugly) naturally leads to a discussion about conditional probability, wikipedia has some interesting numbers to work with under the subheading epidemiology. There's also this great example of a function of several variables (maternal and paternal age).
- Once pregnant, when will the baby be born? This site has statistical table and graphs for the distribution and cumulative distribution for births after 35 weeks, and can be used to investigate questions of conditional probability ("If you're already at 39 weeks, what are the chances the baby will be born within the next week?") as well as cumulative frequency, probability distributions, normal distribution (although it's more likely to be log-normal, but oh well...) and many other topics within probability and statistics. For fun, one could also check and discuss any discrepancies between the answers arrived at in class and the numbers of the complete statistical table here.
- How do babies grow before and after birth? From the stats on this site students could practice creating normal distributions for weight, length, and other values and thereby gain more familiarity with multiple representations involving the normal (log-normal) distribution. WHO offers growth charts used by health professionals world-wide, and this BBC page discusses their usefulness and why they needed to be updated.
There is lots more that can be done with pregnancy and baby health and growth data (for example the birthday problem!), and I think I would be able to form an entire unit on probability and descriptive and inferential statistics based on such data. While not all students will be intrinsically interested in this application, it does seem likely that many will find the experience useful some time in the future.
Right, little mewing noises from the bedroom let me know that time's up.
Have a great time teaching, everyone!
Tuesday, October 30, 2012
More of the same - for a good reason
I'm loving the matching activities I've recently done in class, and my students aren't complaining, either.
So here's another one, on trig functions and graphs. Here it is again, as an editable word document. The last page, with amplitude, period and principal axis, is intentionally left blank so that students can write them down themselves. This is because we had already worked with this terminology the previous class.
If you haven't tried these activities before, then DO. In my classes, these are killer at getting students to think in constructive ways about mathematics, connect representations, develop concept understanding and enjoy math more than they'd ever done before.
For best effect: follow up with a mini-whiteboard/large paper activity in which students create their own graphs from given, or student made, function equations which have changes in several coefficients at the same time.
Thursday, September 27, 2012
The thing about thinking
When facing a math problem, any problem really, that one is motivated to solve, one thinks about it. Maybe not for long, and often in non-productive ways, but still.


I believe that when many students face math problems, their thinking goes something like this:
- I can't do this, can I do this? Maybe, but no probably not, or can I...?
- What should I do? What method should I use?
- Where is the example I should copy?
- It says "triangle" in the question, where are the trig formulas?
- What should I plug into the formulas?
This approach is almost complete procedure-oriented, and often the student launches into a procedure without even bothering to really understand the question. I had a student asking for help recently with a question on compound interest, in which someone had first received 4% p.a. interest for 5 years, and then 3.25% p.a. for the next 3 years. This student understood the idea of compound interest, and knew how to calculate how much there would be after 5 years, but "didn't know what number to plug in for the capital for the second investment period."
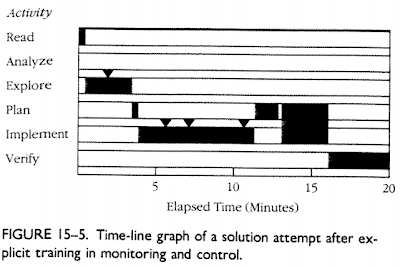
Schoenfield, in this article, shows a time-line of student thinking during a 20 minute mathematical problem solving session. In daily activities such as classwork or homework, I think the student would have given up after 5 minutes.

While I'd like their thinking to go like this:
- What does the question mean? How do I know I understood it correctly?
- What mathematical concepts and language represent the type of event that is described in the question?
- What information do I have? What am I looking for?
- So what's the plan: how will I get what I'm looking for?
- Am I making progress towards a solution, or should I rethink my approach or my understanding of the question?
Schoenfield, presents this timeline of a mathematician solving a problem:

(each marker "triangle" represents a meta-cognitive observation)
So I'm wondering: why are the students preferring non-productive thinking, and how do I get them to change thinking strategies?
My guess is, most students use non-productive thinking because
- they don't care enough about mathematical questions to try to understand them
- they feel stressed when facing mathematical questions, and stress is bad for thinking
- they have been rewarded for this type of thinking before, with teachers who provided examples and then "practice" exercises which only required copying examples
- Their teachers and textbooks have exclusively focused on mastery of procedures
- Finally, some students (especially in younger ages) may have cognitive developmental difficulties in understanding abstract mathematical concepts, while copying procedures is possible even for monkeys.
So what's a teacher to do? Schoenfield suggests the following teaching strategies:
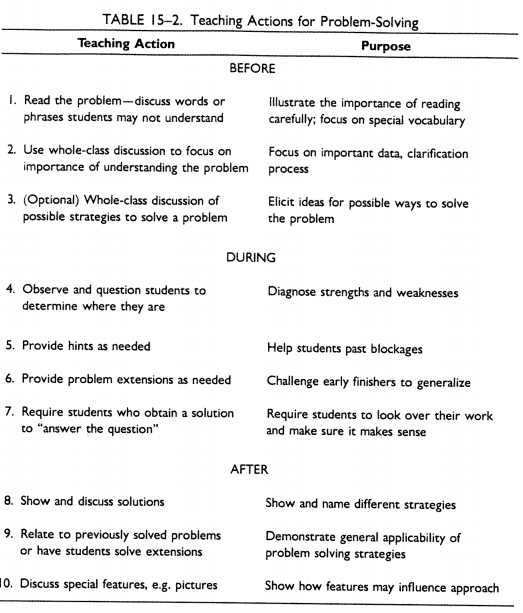
The good news, according to Schoenfield, is that teaching strategies such as those he lists above can bring about dramatic changes in student thinking.

The bad news, is that in this time-line students are still spending almost no time at all analyzing the situation. They do have more meta-cognitive monitoring, and they seem to be planning the approach, but it seems that the approach is still heavily procedure-driven.
So maybe just problem solving (with rich problems) and good teaching strategies surrounding problem solving are insufficient tools for changing student thinking in the direction of understanding. Perhaps we need to give them other types of questions altogether, questions that do not require calculation - but rather "simply" understanding. Malcolm Swan's set of five activities for increasing conceptual understanding are excellent for this purpose. He describes them superbly in this document. Above all, I hope that by using activities that ask students to categorize examples, match different representations, and evaluate mathematical statements, students will learn to aim first and foremost for understanding instead of procedure.
Tuesday, September 25, 2012
A nasty shock
We're starting to work on coordinate geometry, which should be a review of lines: gradients, intercepts, equations, graphing. Students are expected to know how to work with lines since they've been doing it every year for at least four years or so. Yet I always find that students struggle to use points to find the equation of a line.
This time, I decided to first make sure that students were able to see whether a line passes through two points. I designed a small matching activity: given some cards with equations on them, and some cards with pairs of points on them, match the equations with the pairs of points. After they matched everything that it was possible to match, some odd and some empty cards would remain. I was hoping students would use the understanding they developed/formalized during the matching activity to come up with suitable matches for the odd cards.
You can find the cards here.
¨
Easy as pie? No. It turns out that not one of the students in my class (11th grade) were able to match the equations with the points. They had simply no idea of how the x and y in the equation related to the x- and y-coordinates of the points. What the hell have they been learning for four years?
Some approaches that students tried were:
- Getting the gradient by using two points, then comparing this gradient to the one in the equation. Fine, as long as there is just one equation with that gradient.
- Graphing the equations ("but we don't remember how to graph lines from equations") and see if they pass through the pair of points. Fine, if they understood how to graph the lines and if the scale of the graph was appropriate.
- Making a table of values, to see if the pair of points would come up as a pair of values in the table. Fine, as long as the points have integer coordinates and the person has a lot of time and patience.
Sunday, September 16, 2012
Simple and Compound interest: a sorting activity
This is very basic, and does several good things:

When groups are done, I lead a whole class discussion in which the main ideas of simple and compound interest were introduced and defined, and students got a few minutes to derive the general formulas for these types of interests.
I ended the lesson by asking how much Jesus would have had in the bank today, if his parents had invested 1kr at 1% annual interest when he was born. This helped students get the idea that given enough time, compound interest far outgrows simple interest.
- Connect to student understanding of sequences and series (which we had studied the previous weeks), percent, and functions (mine haven't studied exponential growth yet).
- Get students discussing concepts such as interest rates, loans and repayments
- All my students were very actively engaged with thinking and arguing about this activity
- Somewhat self-checking, especially once I told the kiddos that the two columns should be of equal length
What to do:
- Cut out each rectangle and give small groups of students a set of all the rectangles.
- Tell them to sort them into two categories. Or don't tell them the number of categories.
- Eventually hint that the categories should have equal number of rectangles.
- When groups are almost done, walk around and check on their categories, giving hints and pointing out conflicts without giving the solution to the conflict.
When groups are done, I lead a whole class discussion in which the main ideas of simple and compound interest were introduced and defined, and students got a few minutes to derive the general formulas for these types of interests.
I ended the lesson by asking how much Jesus would have had in the bank today, if his parents had invested 1kr at 1% annual interest when he was born. This helped students get the idea that given enough time, compound interest far outgrows simple interest.
Wednesday, September 12, 2012
Update to conflict and discussion in descriptive stats
Well now, yesterday I gave a brief diagnostic quiz about finding mean and median from a frequency table. I wanted to test retention of the methods we had developed the previous lesson.
The results were... interesting.
- About half the class could find the mean, and a bit less than half could find the median. Some students wrote out the raw data first to find these values, and some didn't. I would of course prefer that they didn't have to write out the raw data, however even the fact that they spontaneously make the connection from frequency table to raw data is an important improvement that shows understanding of how the two representations fit together. In the previous lesson, no one started out being able to find mean and median, so overall it's an improvement to see that about half the class now could do it.
- The other half that couldn't find the mean and median seemed to use the same, incorrect and illogical, methods that they had suggested the previous class, almost as if they hadn't already seen that the method was faulty.
- After a very brief go-through of finding the mean and median, we moved on to measures of spread. At the very end of the hour, students received another frequency table and were asked to solve for central tendencies and also measures of spread. This time, it looked to me that all the students in class could find the mean, though some still struggled with the median. Likewise, finding quartiles does not come easy to my students.
What I'm wondering:
- Did some of the students practice understanding and procedures between the two lessons, and might this account for the differences in retention?
- When solving the last example at the end of the lesson, were students doing solving it through understanding, or were they simply copying the procedure of the worked example that we did together?
- Why is it so tricky to find the median and quartiles? Are the students simply not as used to this as they are to the mean? Are they still struggling to get the feel of what the numbers in a frequency table represents?
- Is the retention better than students would normally have after a guided-discovery or direct instruction lesson?
Friday, September 7, 2012
Conflict and Discussion in basic descriptive statistics
Just a quick update: yesterday I was going to have a very boring "you should know this but let's review anyways" lesson on descriptive statistics. It didn't turn out that way.
First, I asked the class for how many siblings each student has, and wrote the numbers on the board.
I asked them how to represent the data in a more presentable way, and we made a frequency table.

I asked them "would it be OK if I erased the original data now that we have a frequency table showing the same information?" Bored yes from everyone. Evil grin from me.
After a column chart (with lots of students wanting to do a histogram instead, so some discussion on that) and a relative frequency column added to the table, the class suggested we find the mean of the number of siblings. Now is when the fun started.
In some cases, students laughed at their own attempts. S2 did this, when she realized she has just summed up all the students and divided by the number of students. S3 also realized his answer was too high to be reasonable, but needed prompting from me to see there was a conflict. S1 however did not realize there was a conflict, and her answer seemed reasonable, too. So I stepped in and pointed out that she didn't take the frequency column into account at all, and that her answer would have been the same even if everyone in class would have had 0 siblings.
After repeated attempts that led to conflicts of different kinds, I think that some kids started to realize the problem: they needed to somehow take the values in both columns into account. But how? Some kids came up with multiplying the siblings and the frequency, but it was only after I explained to the whole class how we could re-create the original data and then find the mean that the class understood (with a collective "Oooh!") what the method is and why it works.
Another conflict occured when students were finding the median. They once again focused on only the sibling-column or the frequency column, but more students this time used the original data and got that the median was 2. This solution was presented to the whole class. A moment later I asked the class how we could avoid writing out the original data ("what if there were 1000 students in this class?") and one student responded that we should average the middle numbers in the frequency column: (6+4)/2=5.
She, and other students, seemed unaware there was a conflict between this answer and the one they knew was right, because they'd gotten it from the original data. So I pointed it out and once again gave the class time to discuss other strategies to use the table. We were running out of time, however, so I wrapped it up rather too quickly by having one student explain his (correct) way of thinking.
Lessons learned:
First, I asked the class for how many siblings each student has, and wrote the numbers on the board.
I asked them how to represent the data in a more presentable way, and we made a frequency table.
I asked them "would it be OK if I erased the original data now that we have a frequency table showing the same information?" Bored yes from everyone. Evil grin from me.
After a column chart (with lots of students wanting to do a histogram instead, so some discussion on that) and a relative frequency column added to the table, the class suggested we find the mean of the number of siblings. Now is when the fun started.
Me: "Any suggestions?"Now I don't know about other kids in other schools, but my kids ALWAYS have trouble finding the mean (and median) from a frequency table. It's like they immediately lose track of the meaning of the table. This time, some very interesting and silly approaches were developed.
S1: "Add all the numbers 0-5 and divide by 18."
Me: OK, (0+1+2+3+4+5)/18 = 0.83.
S1, S2, S3: that can't be right. Most of us had more than 1 sibling, and this shows less than 1.
Me: well, if this isn't right, then discuss among yourselves what could be the mistake here, and how could we fix it.
S1: (0+1+2+3+4+5)/6 = 2.5
S2: (1+4+6+4+2+1)/18=1
S3: (1+4+6+4+2+1)/6=3
In some cases, students laughed at their own attempts. S2 did this, when she realized she has just summed up all the students and divided by the number of students. S3 also realized his answer was too high to be reasonable, but needed prompting from me to see there was a conflict. S1 however did not realize there was a conflict, and her answer seemed reasonable, too. So I stepped in and pointed out that she didn't take the frequency column into account at all, and that her answer would have been the same even if everyone in class would have had 0 siblings.
After repeated attempts that led to conflicts of different kinds, I think that some kids started to realize the problem: they needed to somehow take the values in both columns into account. But how? Some kids came up with multiplying the siblings and the frequency, but it was only after I explained to the whole class how we could re-create the original data and then find the mean that the class understood (with a collective "Oooh!") what the method is and why it works.
Another conflict occured when students were finding the median. They once again focused on only the sibling-column or the frequency column, but more students this time used the original data and got that the median was 2. This solution was presented to the whole class. A moment later I asked the class how we could avoid writing out the original data ("what if there were 1000 students in this class?") and one student responded that we should average the middle numbers in the frequency column: (6+4)/2=5.
She, and other students, seemed unaware there was a conflict between this answer and the one they knew was right, because they'd gotten it from the original data. So I pointed it out and once again gave the class time to discuss other strategies to use the table. We were running out of time, however, so I wrapped it up rather too quickly by having one student explain his (correct) way of thinking.
Lessons learned:
- I wasn't aiming for a conflict and discussion feel to this class, hadn't planned any of it, but took the opportunities that presented themselves because I'd read up on this method the day before. It's nice to see that not all improvements in teaching need to be painstakingly planned.
- Planning would have helped, however. For one, the data could have been such that all common mistakes produced answers that were clearly in conflict with the data. Then I would not have needed to tell the students there was a conflict, they would have noticed it themselves.
- A conflict very obvious to me may not be obvious to the students. Some teacher guidance, or carefully orchestrated group work, is therefore necessary to expose the conflicts and make them available for discussion.
- Multiple representations are a problem for students: on one hand, they can easily move from data to frequency table to column chart - but I shouldn't assume they can go the other direction or that they recognize when one representation is in conflict with another.
- Students were very on-task and seemed more interested than usual. They had started this lesson expecting boring-ol-stats again, but then were lively and active throughout the lesson in a way I haven't seen from this group before.
- Discussion took time. I let it. We were going to "cover" range and standard deviation this class, too, but that just didn't happen. On the other hand, maybe the students will now have more solid understanding of frequency tables which will allow us to not spend as much time on measures of spread.
Thursday, September 6, 2012
Holy shit, I need to do this.
So today I googled "cumulative graph" and ended up rethinking my philosophy and practice of teaching. Doesn't happen every day, to say the least.
Here's how it happened: "cumulative graph" lead to this site, which introduced me not only to what seems to be an outstanding researcher and communicator, Malcolm Swan, but also to a whole set of awesome activities for teaching statistics, algebra, and other things.

Malcolm Swan thus really caught my interest, and google led me to his summary of effective teaching strategies which is extremely user friendly for teachers. What really made me cringe and laugh and decide to shake things up was this collection of powerpoint slides, and especially his comparison of "guided discovery" (what I do a lot of) and "conflict and discussion" (which I mostly do by accident).
To compare the two methods, Swan shows us a problem from from Brekke, 1986, but I think the correct reference is: "Bell, A., Brekke, G., & Swan, M. (1987). Misconceptions, conflict and discussion in the teaching of graphical interpretation." (If someone can find the full article/book excerpt I'd be most grateful, because it's not available through my university library database.)

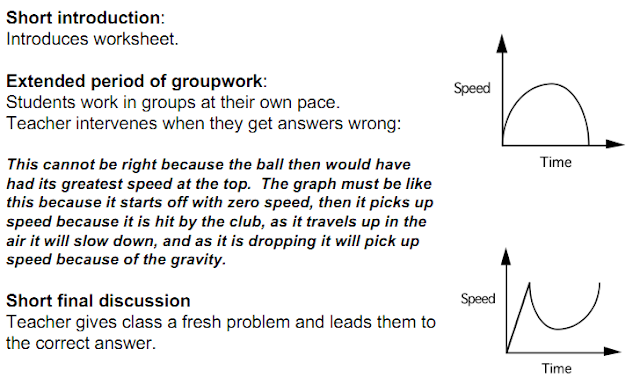

The Guided Discovery approach:
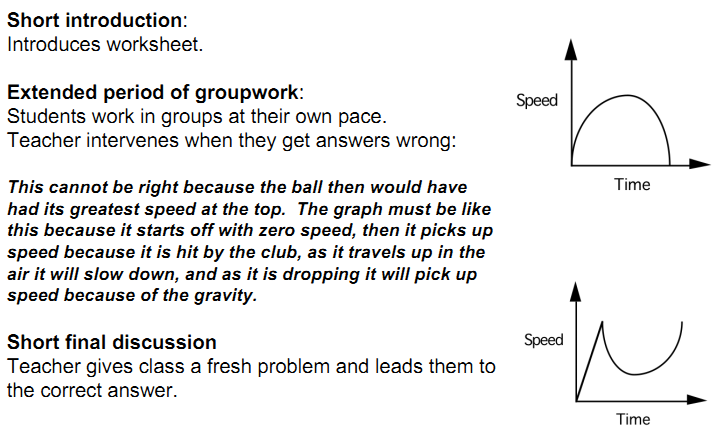
Ouch. I do that. I thought this was the way to do it, you know, guided discovery is the shit, right?
But when someone puts it like this, I don't want to do it no more.
By contrast, the Conflict and Discussion approach involves
- Individual work
- Discussion in small group (opportunity for conflict when group members have different suggestions)
- Writing about what happens in the problem
- Drawing a graph
- Interpreting the graph back into words (opportunity for conflict when words don't match the writing in step 3)
- Discussing the solution with the whole class (opportunity for conflict when classmates have other suggestions)
- Final (long) discussion about what common errors people make, and why.
Each time there is conflict, students restart from step 1.
Results-wise, Swan cites two studies that find that student concept attainment (as measured by pre- and post-tests) is greatly increased in the Conflict and Discussion method. Astoundingly, students retain their understanding even months after the lesson. I think that's what convinced me that give this a serious try.
OK, so how? Well, conflict seems to me to come from several sources:
- Students self-check and find that their solution doesn't work or make sense
- Comparison with other students reveal conflicting solutions
- Students are shown examples of something that they have a hard time fitting into prior concept.
Building these conflicts seems to require the teacher to above all lay off giving the answer, and instead focus on challenging the students with prompts such as "check if it makes sense" and "compare with that guy" or "well how does .... fit with what you're saying?". Actually, I think another way to create conflict is telling the student that his solution makes no sense or is incorrect (even if it's perfectly correct and makes perfect sense) and then just walking away. I'm not sure that will breed a healthy type of frustration in all students, though.
My main problem, as usual, is that discussions take time, and time I don't have. Swan argues that according to research results, it's more effective to focus on just a few problems in depth than many similar-but-slightly-different questions superficially. I'm going to try this, so let's hope he's right.
Sunday, August 19, 2012
Ideas for the new school year
Alrighty, summer is over and students are back in school next week. These few days/weeks at the end of summer and very early start of term is my favorite time of the year because now there is so much energy, and so many possibilities to experiment with when the students finally arrive. So here's what I'm trying this year:
1. Do more mistakes. Last year, I tried "my favorite no" but felt that it took a bit too much of class time. This year we will continue trying to improve "my favorite no" and also we will analyze the mistakes at mathmistakes.org. Finally, we're definitely going to try the Mistakes Game, in which students collaborate to create and present problem solutions that contain realistic mistakes.
2. Get into whiteboarding. 10 mini-whiteboards sized 30x42 cm are on their way to my school, and I think they will be suitable at least for pair-work. I'll try to make my own larger whiteboards later on for larger groups. What are we doing with the whiteboards? Here are some ideas, many borrowed from Bowman Dickson:
3. Let go of homework. I'm not giving up, exactly, on getting kids to do homework. It's just that this battle is one I've been fighting and losing for the past four years, so rather than continue to frustrate myself and the students I'm going to let go, lick my wounds, and take some time to build new strategies (which might involve the whole school culture rather than just my own classes). There is only one thing I'm going to try this year, and it's based on a suggestion from our physics teacher (thanks, Johan!). Students will receive one small quiz weekly, and this quiz will be on just one of perhaps 6 "model solutions" demonstrated during class the week before. So students will always have a very limited number of questions and solutions to understand or in the worst case simply memorize for the quiz. Not ideal, I know, but for many students even if all they do is memorize 6 questions and solutions then that's a huge improvement on their previous efforts.
What I'd like to add to this approach is to either include a question on the quiz asking students to justify a step of the solution, or to finish each quiz with a group/whole-class discussion of why the solution is appropriate.
1. Do more mistakes. Last year, I tried "my favorite no" but felt that it took a bit too much of class time. This year we will continue trying to improve "my favorite no" and also we will analyze the mistakes at mathmistakes.org. Finally, we're definitely going to try the Mistakes Game, in which students collaborate to create and present problem solutions that contain realistic mistakes.
2. Get into whiteboarding. 10 mini-whiteboards sized 30x42 cm are on their way to my school, and I think they will be suitable at least for pair-work. I'll try to make my own larger whiteboards later on for larger groups. What are we doing with the whiteboards? Here are some ideas, many borrowed from Bowman Dickson:
- Mistakes game
- Rotating during a solution: groups finish other groups’ solutions during a gallery walk, or students take turns writing the steps to a solution within their group.
- Using color: chain rule, highlighting mistakes, rotating
- Guess and Check: one person guesses an answer, the other checks if it’s right
- Solve and justify: one person writes the steps of a solution, the other justifies each step.
- Each group comes up with their own problem: then gallery walk with each team solving each other group’s problems.
- Each group comes up with an example of a concept, then shows it to the class.
- Each group writes an answer to a teacher-driven question – shows to the teacher
- Polling for multiple choice questions: can be summarized on the board
- Groups create multiple representations of the same idea: good for functions!
- Groups create different solutions to the same problem.
- Groups create several problems related to the same information (information is given, or is asked for, or can be an intermediate step)
3. Let go of homework. I'm not giving up, exactly, on getting kids to do homework. It's just that this battle is one I've been fighting and losing for the past four years, so rather than continue to frustrate myself and the students I'm going to let go, lick my wounds, and take some time to build new strategies (which might involve the whole school culture rather than just my own classes). There is only one thing I'm going to try this year, and it's based on a suggestion from our physics teacher (thanks, Johan!). Students will receive one small quiz weekly, and this quiz will be on just one of perhaps 6 "model solutions" demonstrated during class the week before. So students will always have a very limited number of questions and solutions to understand or in the worst case simply memorize for the quiz. Not ideal, I know, but for many students even if all they do is memorize 6 questions and solutions then that's a huge improvement on their previous efforts.
What I'd like to add to this approach is to either include a question on the quiz asking students to justify a step of the solution, or to finish each quiz with a group/whole-class discussion of why the solution is appropriate.
Friday, August 10, 2012
TIMSS research plan
This last spring, I wrote a research proposal for a ph. d. position in "behavioral measurements", focusing on understanding international differences in mathematics understanding as measured by TIMSS and PISA. Recently, I've seen a renewed interest in TIMSS results online, as for example in Michael Pershan's video critique of Khan Academy.
So I'm thinking if I post part of the research proposal here, maybe people will find the "research overview" part interesting and relevant to the times. Parts of the proposal are about Sweden, but from what I understand much is highly relevant for the US as well. Sorry for the sketchy formatting which happened when I copy-pasted from MsWord.
Oh, and I did get that ph. d. position, it fit me like a glove and I happily accepted. Unfortunately it would have required me to relocate to a different town, and recent family developments made relocation currently impossible. Oh well - I'll always think of this position as "the one that got away."
---------------------------------------------------------------------------------------------
Specific Objectives and Aims
The overarching aim of this
project is to use existing international TIMSS data to understand the factors
that influence the quality of mathematics education in Swedish schools. Ever since the first international
comparisons of mathematics knowledge in middle-school students, Sweden has
positioned itself at or below the average score of participating nations (Hellerstedt, 2011). Between TIMSS 1995 and TIMSS 2003, the results of Swedish 8th
grade students decreased by 41 points, which is more than any other country
among the 16 that participated in both 1995 and 2003 (Skolverket, 2004), and
then decreased even further by TIMSS 2007 (Skolverket 2008). By contrast, other nations, such as our neighbors
Finland and Russia, have shown consistently higher results in international
comparisons.
Such differences between nations
deserve attention because they signify that mathematics education can be more effective
than is the case currently in Sweden. By identifying the causes behind the
relative successes of high-performing nations, Sweden might be able to emulate
them and thus achieve more efficient use of school finances as well as a more
mathematically literate population. However, what works in one country may not
work in another cultural and economic context. It is therefore necessary to take into
consideration factors that affect mathematics education within Sweden, as well
between Sweden and other nations. While
TIMSS tries to be curriculum-neutral, so that it can be applied to all nations,
it can be argued that the mathematics knowledge measures by TIMSS does not
constitute mathematics knowledge in its entirety, that the questions target
only specific aspects of mathematics knowledge such as specific subject areas
or skills. In order to enable research
of these international differences, TIMSS and PISA are accompanied by in-depth
data regarding the questions in the test, as well as a wide range of detailed contextual
data about variables at the student, teacher and school levels of the
participating nations.
The three main
objectives of this proposal are:
|
Overview of the Research Area
The achievement of the above stated objectives
will be made possible by a close analysis of relevant parts of the large amount
of data collected in the TIMSS mathematics reports. This data includes results
for each participating nation on different types of questions in the different
areas of mathematics tested in TIMSS.
Also included is contextual data such as statistics on student, teacher,
school and curriculum variables in each participating nation. Next, we
shall see several research studies that to varying degrees, and with different
aims, make use such contextual data.
One of the most relevant studies
regarding international differences in TIMSS mathematics results is the TIMSS
Videotape Classroom Study (Stigler, 1999a) which was created together with the
1995 TIMSS mathematics study (Beaton, 1996).
Stigler used video recording in order to compare instructional practices
in 8th grade mathematics lessons in Germany, Japan, and the United
States. In a large sample of in total
281 classrooms, chosen to be representative of classrooms in each country, one
lesson per year was randomly chosen and filmed.
Results show that, among many other differences, Japanese classrooms
include more complex problem-solving tasks and higher difficulty mathematical
content than do their German and United States counterparts. In a popular description of this study and
its findings, Stigler and Hiebert claim that it is such differences in
instructional practices which influence some international differences in
mathematics knowledge (Stigler, 1999b).
A related study points in a somewhat
different direction. Leung (2005)
analyzed the data from the larger scale TIMSS video study that was made in
conjunction with the TIMSS 1999 mathematics study (Mullis, 2000). In this larger and more recent video study, 7
countries (Australia, Czech Republic, Japan, Hong Kong, the United States, the
Netherlands, and Switzerland) were included with a total of 638 videotaped
lessons. When comparing the East Asian nations to other nations, Leung observed
that East Asian nations provide students with learning opportunities involving
complex mathematical problems often featuring high level mathematical
difficulty and logical reasoning such as proofs. However, the two East Asian
nations differed from each other in that Hong Kong classrooms are highly
teacher-directed, while Japanese classrooms very much less so. Leung concludes that East Asian classrooms
are highly heterogeneous, and that the success of East Asian nations in
international comparisons must be understood as resulting from interactions of
cultural factors such as perceptions of education and high expectations in the
classroom. These video studies show that although there are differences in
instructional factors between high-performing and low-performing nations, not
all such differences are causal factors of mathematics knowledge. Also high-performing nations may have some
common and some different strategies to ensure high levels of mathematics
knowledge.
While the video studies have yielded
much valuable data about instructional practices, other research has focused on
psycho-social differences such as attitudes towards oneself in relation to
mathematics. Shen (2008) aimed to
investigate the relationship between self-perception in mathematics and TIMSS
results in 8th graders in the 1995, 1999, and 2003 TIMSS
studies. Using statistical analysis of
relevant TIMSS contextual data, Shen found that within each country, there is a
positive correlation between mathematics results and perceived competence in
mathematics, how much the student likes mathematics, and how easy the student
perceived mathematics to be. Between
countries, however, the relationship is reversed such that the students in the
highest performing nations are the ones who report liking mathematics less,
judge it to be difficult, and have low opinions of their competencies in
mathematics. Shen attributes this surprising relationship to higher academic
standards in high-performing nations, and lower standards in lower-performing
nations.
Findings such as those in Shen’s study
can be questioned on methodological grounds, since the assumption is that the
surveys used in the collection of TIMSS contextual data are valid for all
participating nations. Eklöf (2007) challenges this assumption by conducting
in-depth analysis of the Swedish TIMSS data on mathematics self-concept and
students valuing of mathematics. While the former of these is shown to be
consistent and correlated to mathematical achievement, this was not true of the
latter. Eklöf’s research, among others,
illustrates the need for careful statistical investigation of the scales used
in the TIMSS contextual data before using the contextual data for secondary
analysis. Eklöf and Shen show that TIMSS data must be analyzed for both
between-countries and within-country differences if we wish to understand the
factors that influence mathematics knowledge.
Another area of research into student
variables is illustrated by Boe (2002).
Boe investigated whether student task persistence (a variable not
included in the TIMSS contextual data), as measured by the percent of
background questionnaire questions students completed, was related to
mathematics results on the TIMSS 1995 test. The results indicated a
surprisingly strong correlation (ranging from 0.72 to 0.79 for 7th
and 8th grade students) between task persistence and mathematics
results on a between-nations level of analysis. The relationship between task persistence and
results appeared much smaller at the classroom and student levels, however, and
in total task persistence accounted for about 0.28 of the total variation
between students participating in the TIMSS 1995. Such findings are difficult to interpret.
First, we do not know whether the strong correlations indicate any causal
relationships between the variables. There could be a third factor on a cultural level, such as ability
to delay gratification (Mischel, 1989, shows a moderate correlation between
delayed gratification and SAT scores), or test-taking motivation (Eklöf, 2006,
finds a weak but significant correlation in the Swedish TIMSS 2003 sample),
that causes both increased task persistence and higher mathematical
achievements on the TIMSS tests. Also,
it is strange that the correlation is smaller on the student level than on the
national level. From Boe’s study, it is clear that TIMSS contextual data demands
analysis beyond just looking for correlations, and that the relationships found
require careful interpretation in terms of findings from cultural and
psychological research.
Of special interest for this research
proposal is the research that has been done on mathematics knowledge in Nordic
countries in general, and Sweden in particular. Kjaernsli (2002) investigates
similarities and differences between the Nordic countries, excluding Finland,
and finds that their results on the TIMSS science and mathematics tests are similar
and may be connected to cultural factors such as the reluctance to put academic
pressure on young children. Finland, by
contrast, has seen a dramatic rise in mathematics results as measured by TIMSS
and PISA since 1999. It is of great international interest to determine the
factors behind Finland’s success, and recently much research has been made with
this aim. Välijärvi (2003) aims to present a broad look at factors influencing
Finland’s rise to success. Välijärvi
identifies factors such as educational equity in comprehensive shools, cultural
homogeneity, and highly educated teachers.
Interestingly, Välijärvi also points out that some factors seem to be
more important in Finland than in other OECD nations. The within-country correlation found by Shen
(2008) between self-perception and mathematics achievement is significantly
higher in Finland than elsewhere. Research such as Välijärvi’s further illustrates
the need for both between-nation and within-nation investigations of factors
influencing mathematics achievement.
TIMSS aims to establish the success of
mathematics education in terms of how well students achieve the educational
goals formulated by their own nations, whether at the state or local levels. It
is therefore very important to investigate to what extent TIMSS questions are
aligned with the Swedish curricula, both in terms of the subject matters
covered (geometry, algebra, etc.) and the skills which students are meant to
develop (reasoning, application of procedures, etc.). However because of the
loosely formulated goals in the government-issued curriculum documents, we
should be wary of using those documents to understand the implemented curricula
in the Swedish schools. Instead, it makes better sense to analyze teacher
responses about their intentions and expectations within their implemented
curricula (Skolverket, 2004).
Teacher responses to TIMSS
questionnaires indicate that students have received relatively more instruction
in arithmetic and measurement, and less in algebra and geometry, compared with
students in other nations as well as compared with the proportions that each
subject area has in the TIMSS examinations (Skolveket, 2004). Also, Alger (2007) finds that Swedish
teachers compared to teachers in other nations report using a larger proportion
of class time on independent practice with mathematics exercises, and less time
going over homework and lecturing.
Lindström (2006) considered differences between Swedish national tests
(though he used an old test from 1992) and TIMSS 2003 and PISA 2003. He found
that the exercises are about equal in difficulty level, but the Swedish test
had much less emphasis on reasoning and on applications, and more emphasis on
identifying and carrying out procedures.
One major limitation of Lindström’s study is that the Swedish national
tests have changed considerably since 1992. However, Lindström’s results find
support in a more recent in-depth analysis (Skolverket, 2009) of student
responses to the TIMSS 2008 Advanced and the Population 3 responses to TIMSS
1995. This analysis is based on the
patterns of correct and incorrect solutions, and frequent mistakes, made by
Swedish students and reveals that Swedish upper secondary school teachers since
1995 have increasingly focused on procedural knowledge rather than conceptual
and reasoning based understanding of mathematics. Together, these studies indicate that there are variables at the
instruction level that affect Swedish students’ results on the TIMSS
assessments.
On a school level, there are other
important variables identified in the responses from teachers and principals. Overall
Swedish students in grades 4 and 8 receive substantially fewer instructional
hours compared to the OECD average, this difference in grade 8 is approximately
25% and is even larger (closer to 40%) in grade 4. In addition, few Swedish
students receive extra mathematics instruction outside of school and report
much less frequent homework and less time spent on homework compared with OECD
averages (Skolveket, 2004). Thus, it is reasonable to assume that
school-level factors also play a role in determining students’ mathematical
knowledge.
Research questions
In light of the background research
presented above, the main research question in this research proposal is:
Research question:
To what extent do school- and teacher-level variables influence Sweden’s
mathematics results on international tests?
In order to investigate
the main research question, it is necessary to consider several related
questions:
1.
What types of
mathematical knowledge is measured by TIMSS?
2.
Are the TIMSS
measurements reliable and valid?
3. What statistical
analysis methods are relevant for studying TIMSS secondary data in search of
potential causal relationships?
4.
To what extent are the
aforementioned statistical methods valid?
Potential
causal factors can be divided into several categories:
5.
What instructional
factors influence mathematics achievement within Sweden?
6.
What instructional
factors influence mathematics achievement differences between Sweden and other
nations?
References
Alger, S. (2007).
Svenska skolans lärare och
undervisning i matematik och NO i ett internationellt perspektiv: Några resultat från TIMSS 2003.
(BVM 32:2007). Umeå: Umeå universitet, Department of Educational
Measurement.
Beaton,
A., Martin, M. O., Mullis, I., Gonzalez, E. J., Smith, T. A., & Kelley, D.
L. (1996). Mathematics
Achievement in the Middle
School Years: IEA's Third International Mathematics and Science
Study. Chestnut Hill,
MA: Boston College.
Boe, E. E., May, H., & Boruch, R. F. (2002). Student task persistence in the Third International Mathematics and
Science Study: A major source of achievement differences at the national,
classroom, and student levels (Research Rep. No. 2002-TIMSS1).
Philadelphia, PA: University of Pennsylvania, Graduate School of Education,
Center for Research and Evaluation in Social Policy.
Eklöf, H. (2006). Motivational
Beliefs in the TIMSS 2003 Context. Theory, Measurement and Relation to Test
Performance. Doctoral dissertation.
Umeå: Umeå University, Department of Educational Measurement.
Eklöf, H. (2007). Self-concept and valuing of mathematics in TIMSS
2003: Scale structure and relation to performance in a Swedish setting.
Scandinavian Journal of Educational Research, 51(3), 297-313.
Hellerstedt, L., & Reistad, H. (2012, January 22). Matteutveckling för miljarder. Origo, 1.
Retrieved March 22, 2012, from
http://www.lararnasnyheter.se/origo/2012/01/22/matteutveckling-miljarder
Leung, F. (2005). Some characteristics of East Asian mathematics
classrooms based on data from the TIMSS 1999 video study. Educational Studies in Mathematics, 60, 199-215.
Lindström, J. (2006). Med
fokus på matematik och naturvetenskap: en analys av skillnader mellan
internationella jämförande studier och nationella kursplaner. Stockholm:
Skolverket.
Mischel, W., Shoda, Y., & Rodriguez, M. I. (1989). Delay of gratification in children. Science,
244, 933-938.
Mullis, I.V.S., Martin, M.O., Gonzalez, E.J., Gregory, K.D., Garden,
R.A., O’Connor, K.M., Chrostowski, S.J. & Smith, T.A. (2000) TIMSS 1999 International Mathematics Report:
Findings from IEA’s Repeat of the Third International Mathematics and Science
Study at the Eighth Grade. Chestnut
Hill, MA: Boston College.
Nyström, P.
(2006). TIMSS fixpunkter. En analys av
vad elever med olika resultat i TIMSS
2003 vet och kan göra. (BVM 20:2006). Umeå: Umeå universitet, Department of
Educational Measurement.
Nyström, P., & Lind, A.
(2009). Hur samstämmiga är svenska styrdokument och nationella prov med
ramverk och uppgifter i TIMSS Advanced 2008. Stockholm: Skolverket.
Reinikainen, P. (2004). Explanatory variables of
science achievement in Finland: Cultural approach. In C. Papanastasiou (Ed.), Proceedings of the IRC-2004. IEA
International Research Conference (Vols. 1–4).
Kjaernsli, M., & Lie, S.
(2002). Timss science results seen from a nordic perspective. In D. Robitaille
& A. Beaton (Eds.), Secondary Analysis of the TIMSS Data (pp. 193-208). New York: Kluwer
Academic Publishers.
Shen, C., & Tam, H. P. (2008). The
paradoxical relationship between student achievement and self-perception: A
cross-national analysis based on three waves of TIMSS data. Educational Research and Evaluation, 14, 87–100.
Skolverket.
(1996). TIMSS 1995: Svenska 13-åringars kunskaper i matematik och
naturvetenskap i ett internationellt perspektiv. Stockholm: Skolverket.
Skolverket.
(2004). TIMSS 2003: Svenska elevers kunskaper i matematik och naturvetenskap
i skolår 8 i ett nationellt och internationellt perspektiv. Stockholm: Skolverket.
Skolverket.
(2008). TIMSS 2007: Svenska grundskoleelevers kunskaper i matematik och
naturvetenskap i ett internationellt perspektiv. Stockholm: Skolverket.
Skolverket.
(2009). Svenska elevers kunskaper i
TIMSS Advanced 2008 och 1995: en djupanalys av hur eleverna i gymnasieskolan
förstår centrala begrepp inom matematiken. Stockholm: Skolverket.
Stigler, J. W. (1999a). The TIMSS Videotape Classroom Study: methods
and findings from an exploratory research project on eighth-grade mathematics
instruction in Germany, Japan, and the United States. Washington, D.C.:
U.S. Dept. of Education, Office of Educational Research and Improvement.
Stigler, J. W., &
Hiebert, J. (1999b). The teaching gap: best ideas from the world's
teachers for improving education in the classroom. New York: Free Press.
Välijärvi, J., Linnakylä, J., P., Kupari, P., Reinikainen, P., &
Arffman, I. (2002). The Finnish success in PISA - and some reasons behind
it: PISA 2000. Jyväskylä: Institute for Educational Research, University of
Jyväskylä.
Tuesday, May 29, 2012
Scaffolding questions
I'm coming to believe that for a vast majority of (my) students, mastery is the key to motivation. Yes, I could try to include more inherently engaging activities such as wcydwt activities, but ultimately what will get the students to open their books at home is feeling confident about their own abilities to learn and do mathematics. As teachers, we can help build this confidence by proper scaffolding in class. Until now, I've used group work to provide some scaffolding, but now I'm trying scaffolding by ways of phrasing questions. Yesterday's class was about the derivatives of trigonometric, exponential, and logarithmic functions (only e^x and ln(x) are included in this course), so I'll use questions on this topic as examples.
- Show that: Show that if f(x) = sin(x^2) + e^(sin(x)) then f'(x) = 2xcos(x^2)+cos(x)*e^(sin(x)). This is an example of the "Show that A can be transformed by some relevant mathematical process into B" type of question. Such questions have the advantage that students at least know where they are going, and just have to find a way to get there. Also, the question itself provides immediate feedback on the accuracy of student work. Someone still has to ask the student to explain every step of their solution, but other than that the question is pretty self-contained.
- Spot my mistake: I claim that if f(x) = ln(x^3) + e^(x^2)*cos(x) then f'(x) = 3/x - 4*e^(4x)*sin(x). What is my mistake? This is an example of the "Critically examine to find a mistake and try to understand what the person making the mistake was thinking." Most of my students really struggled with this one because they did not recognizing the need for product rule. There were a lot of good discussions going on between students comparing their ideas of what might be wrong in the solution. To me, the benefits of this type of question are that they promote critical/logical meta-cognitive reasoning and discussion.
- Verify: Is it true that if f(x) = ln(sin(x^3)) then f'(x)=1/tan(x^3)? If not, explain what misunderstanding might have caused the mistake. This of course is very similar to the second type of question, but a little less scaffolded because the students are not told to expect a mistake. Once again, this gives rise to good discussions between students about whether the solution is correct, where potential mistakes are, and what misunderstandings/correct understandings give rise to this solution.
All-in-all, I see these questions as best being used in sequence, though depending on the difficulty/novelty of the topic one or all steps may be skipped. After these scaffolded questions students should be ready for the classic "solve this..." exercises. Because the three question types mentioned above have other benefits than just providing scaffolding, it makes sense to me to intermittently use them for variation and to encourage reasoning and discussion even once students are confident with the less scaffolded exercises.
Some questions that need to be answered: how do we ensure that students gradually let go of the scaffolding (their classmates, their books and notes)? How can scaffolding activities be combined/coexist with explorative investigation-driven open-ended work?
Friday, April 20, 2012
Tangents and normals - a peer scaffolding lesson
Yesterday we had a nothing-special lesson, with no great outbursts of creativity, which nevertheless went very well and is the kind of staple lesson-setup that requires very limited preparation..
The goal: students should understand the concepts of tangents and normals to a curve, and be able to calculate the equations of these lines.
It's not exactly brain surgery, but then I find students often get lost in questions about tangents and normals: they have a hard time connecting the many relevant concepts: derivative, gradient, equation of a line, constant term, perpendicular, negative reciprocal, etc. They start doing funny things, like plugging in values of x into the derivative function instead of the original function in order to find the corresponding value of y. They lose track of what they're doing.
So for this lesson (as for almost all topics in calculus) we used algebraic and visual representations throughout, in parallel. I find it really helps students understand and keep track of their work, and check whether their work seems reasonable.
I put a "do now" question on the board: what is the equation of the tangent to the function..." and gave them a simple cubic function. Five minutes to work, in pairs, and everyone had found the gradient of the tangent, and many had also found its y-intercept. Some got a minus sign wrong, and could quickly see on the graph (which stretched close to, but not including the y-intercepts) that they must be mistaken. Go-through together and everyone's on track.
Follow up: is there any other point on the graph of f that has the same gradient of tangent? Five minutes pair-work, and most students set up, and at least attempt to solve, the resulting quadratic equation. A few needed a hint, because they attempted to set the equation of the tangent equal to its own gradient... Sure sign they were having a hard time connecting the derivative function with the gradient of tangent. This will be solved once we do more work on using the derivative for graphing the function.
Go-through together, and we're fine.
My only act of "telling" during this lesson was when I introduced the concept of a normal as a line perpendicular to the tangent at a certain point on the graph. A few students recalled that perpendicular lines have gradients that multiply to -1, and we were ready to go. There was a bit of the "do we use the same point? where do I plug this in?" going on, but when I brought their attention back to the graph on the board, they answered their own questions easily.
So all in all - students helped each other learn about tangents and normals, they worked efficiently during the whole lesson, and seemed to understand and enjoy the topic.
Tuesday, April 17, 2012
Inferential statistics - main ideas
In my opinion, inferential statistics is one of the most important and most difficult to teach of all the topics in high school mathematics and psychology courses. I get to teach it twice, in math, where the focus (unfortunately) is to manually carry out the Chi-square calculations, and in psychology, where the emphasis is on understanding the need for the test and interpreting the results. Psych students even do their own experiment, where one of the things being assessed is their ability to set up, justify, carry out, interpret, and discuss inferential statistical analysis of their data. It's a challenging task for most students.
So far, I've taught inferential statistics every year, and never felt really satisfied with the outcome. Yes, my students can copy my example to obtain a test-statistic and compare it to the critical value in the book. Yes, they can even say "thus we reject the null hypothesis." But rarely do they demonstrate true understanding. This year's attempt to teach inferential stats failed, as usual. Students complained so much about their lack of understanding (I love when they do that) that I decided to give it another, serious, try.
So for today, I considered the main difficulty in understanding inferential statistics. I think the main difficulty is understanding that random variation might create differences between groups that are due to chance. So I started with an object students know behaves randomly, a coin, and focused the lesson on the concept of random variation.
The setup: a normal coin, which I flip 15 times. Record number of heads and tails in a contingency table.
Then I "bless" it. I make a show of it, concentrating hard and blowing on the coin carefully in cupped hands.
Next I flip the coin another 30 times.
It turned out that before the blessing, the coin came up 5 heads and 10 tails. After the blessing it came up 13 heads and 17 tails. Oh my, my blessing made the coin come up heads more than twice as much! Students immediately complained that I should take into account the different number of flips in each condition, thank you students. We calculated percentages. 33% heads without blessing vs 43% heads with blessing.
Key Question: did my blessing work? Students were laughing at this, and suggesting wonderful things, like that the difference might be too small, and the sample too small, to be sure the results weren't merely due to chance. So how big should the difference be, for this sample, and how sure is "sure"? This led us into significance levels, and the need for statistical tests. We did a chi-square online (vassarstats is great for this) and when we saw that the p-value was 0.75 we concluded that the difference in heads was most likely due to chance. We experimented with changing the data a bit, say what if there was 29 heads and 1 tail in the "blessed" condition? Students agreed that would be more convincing, and voilá the p-value was less than 0.001.
That's nominal data. I also wanted students to experiment themselves, and to obtain ordinal data to use with a Mann-Whitney U-test. So I asked: "Are you telepathic?"
Students paired up. One student in each pair thought (but didn't speak) of a word, either "BIG" or "small". The other person then said a number, any number. The was tallied up in two columns according to the two words. At the end, I picked the data of one pair of students and calculated the medians. Oh my - the median for BIG numbers was 87.5, compared to just 15 for the small numbers. Students thought about this, could they be sure their classmates were telepathic? We did a Mann-Whitney U-test online (thanks again, vassarstats) and found a p-value of 0.009. Students were impressed. We concluded that we can be at least 95%* (or even 99%) sure that this pair of students were telepathic, except...
What if there wasn't a random variation causing the difference in results? What if the variation comes from confounding variable within the experiment? Students were saying that maybe the girl thinking of the word somehow consciously or unconsciously signaled the word she was thinking. Someone said humans have a hard time being truly unpredictable and random. So we arrived at the conclusion that more evidence is needed, and that statistical tests can only (at best) rule out that the difference is due to random variation but that there can still be other threats to validity present.
Overall, I am very pleased with this lesson. I am happy I chose a coin, even more happy I chose ESP - something many students are naturally curious about and have already considered in a somewhat relevant manner. Many students told me later that they finally got the idea, that it made sense, that it was obvious that descriptive stats is insufficient to draw conclusions about data. They could even transfer their understanding to psychology, to explain how participants in an experiment might be randomly different from each other or even compared to themselves at an earlier point in time. I am particularly happy with the telepathy-experiment. At first I thought that I should have made them flip a coin to decide what word to think about, to make it truly unpredictable, but because their choice of words wasn't perfectly random we had that very good discussion about internal validity and confounding variables which I think deepened students' understanding of the power and limitations of inferential statistical tests.
Some changes I'll do for next time: provide each pair of students with a computer so they can do the test themselves. Spend more time working with hypotheses and writing up the results of the inferential test. I want them to say "therefore the difference between conditions is significant and we should reject the null hypothesis" so we should have spent more time saying, and thinking, about this statement and what it means.
*Yes, I know that this is an incorrect interpretation of significance level. I know, and it hurts me to teach it this way. But seriously I think I must, at least to begin with, because students are simply not ready/able/given enough time to fully understand the concept of significance according to the frequentist approach to statistics. I comfort myself with the thoughts that hey, priorities gotta be made, and that perhaps, if looked at from a Bayesian perspective, what I'm teaching my students actually makes sense. It's a hard decision, though.
Monday, April 2, 2012
Perplexing!
I've recently had the opportunity to peruse a substantial amount of research articles about international differences in mathematics knowledge, as measured by TIMSS and PISA. I found some very interesting things in there, such as that amount of time spent on homework has a negative correlation to mathematics achievement both within and between nations. Meanwhile, frequency and effort put into homework has a positive correlation with mathematics knowledge. That's all good and great and I'm already changing how I talk to students about homework, but other results from the research studies are just bewildering:
- If a student likes math, and believes in her own ability to do math, that's gotta mean the student is more likely to develop good understanding of math, right? Well, not really. Within nations, this relationship holds, and in some nations (such as Finland) the correlation is positive and quite high. But between nations, the relationship is actually the opposite: students in high-performing nations report that they like math less and consider themselves to not be good at it, compared to students in low-performing nations (Shen, 2008).
- A student who is persistent with finishing tasks is likely to learn more math. That, by itself, is not weird. But Boe (2002) found that task persistance (as measured by the number of background questionnaire items answered by students in the TIMSS 1999 study) has a high correlation to mathematics achievement between nations, but less so between classrooms and very little between students. So nations in which students answered many of the background questionnaire items, which require no knowledge of mathematics or science, did better than nations in which students answered only a few of the questions. The correlation was around 0.75. On a student level, when comparing students within classrooms, the correlation was much lower. Overall, this "task persistance" variable seems to account for about 1/3 of the overall variation in results among students worldwide, and about half of the variation between nations. This is BIG. To my knowledge, no other variable has been found that explains so much of the variation. But what does it mean? Does it reflect cultural values of conscientiousness and long-term orientation (would explain why East Asian nations do so well)? Or is it that students who expect to do well on the TIMSS are more motivated to fill in the questionnaire? And WHY is the relationship strong at the nation-level but not student-level? And why, given the stunning results, has this study been cited only a handful of times since it was published 10 years ago?
- One reason that Swedish researchers are interested in the TIMSS background data is that Sweden has seen a dramatic drop from acceptable to outright poor results (still better than the US, though) from TIMSS 1995 to TIMSS 2007. "Why is this happening?" we're asking. Well. Hidden among the data are little-known figures such as these: Swedish 4th-graders receive almost 30% less mathematics teaching per year than the OECD average. 8th-graders receive 20% less than OECD average. Meanwhile the Swedish media and government has aggressively blamed teachers for the poor results. To be fair, there is not a strong correlation between amount of teaching hours and mathematics knowledge. Finland, for example, ranks very high but has the fewest teaching hours of all the participating nations. US, on the other hand, has plenty of teaching hours, yet achieves very low ranking. Yet it's difficult to ignore that East Asian nations and Russia, who always top the ranks-lists, not only provide students with a LOT more teaching (South Korea for example gives students 220 teaching days each year, compared with 178 in Sweden), but also in these nations many students go to after-school mathematics tutoring.
That's it for now.
Boe, E. E., May, H., & Boruch, R. F. (2002). Student task persistence in the Third International Mathematics and
Science Study: A major source of achievement differences at the national,
classroom, and student levels (Research Rep. No. 2002-TIMSS1).
Philadelphia, PA: University of Pennsylvania, Graduate School of Education,
Center for Research and Evaluation in Social Policy.
Shen, C., & Tam, H. P. (2008). The
paradoxical relationship between student achievement and self-perception: A
cross-national analysis based on three waves of TIMSS data. Educational
Research and Evaluation, 14, 87–100.
Subscribe to:
Posts (Atom)